Retail property · REIT · Systems · Visuals
Retail Mall Way Finding Signages System
Designing spatial & environmental signages for 2.5mil sf. retail mall. Implement systematic workflow and enable faster tenant's brand update and signages installation.
Overview
Managing over 800 tenants for 2.5 million square feet mall is such a tedious activity because it require constant monitoring and update around the clock, based on tenant’s status. As a designer in the management group, I was tasked to frequently monitor and update more than 200 spots of way finding signages (information; INF, directional;DIR and identification; IDN) through digital and print medium for customer’s in mall experiences within the next day of commencement date.
While each tenant’s data set is not just about the brand name, included are their spatial information such as lot number, locations criteria (wing, level, nearby tenant as remarks), pin point location on floor map, making the original data set to be 4 times bigger in order to have a complete installed and visible signages for customers.
It is not a single, independent and one-off task, it has their own and unique way of synchronization.
Problem
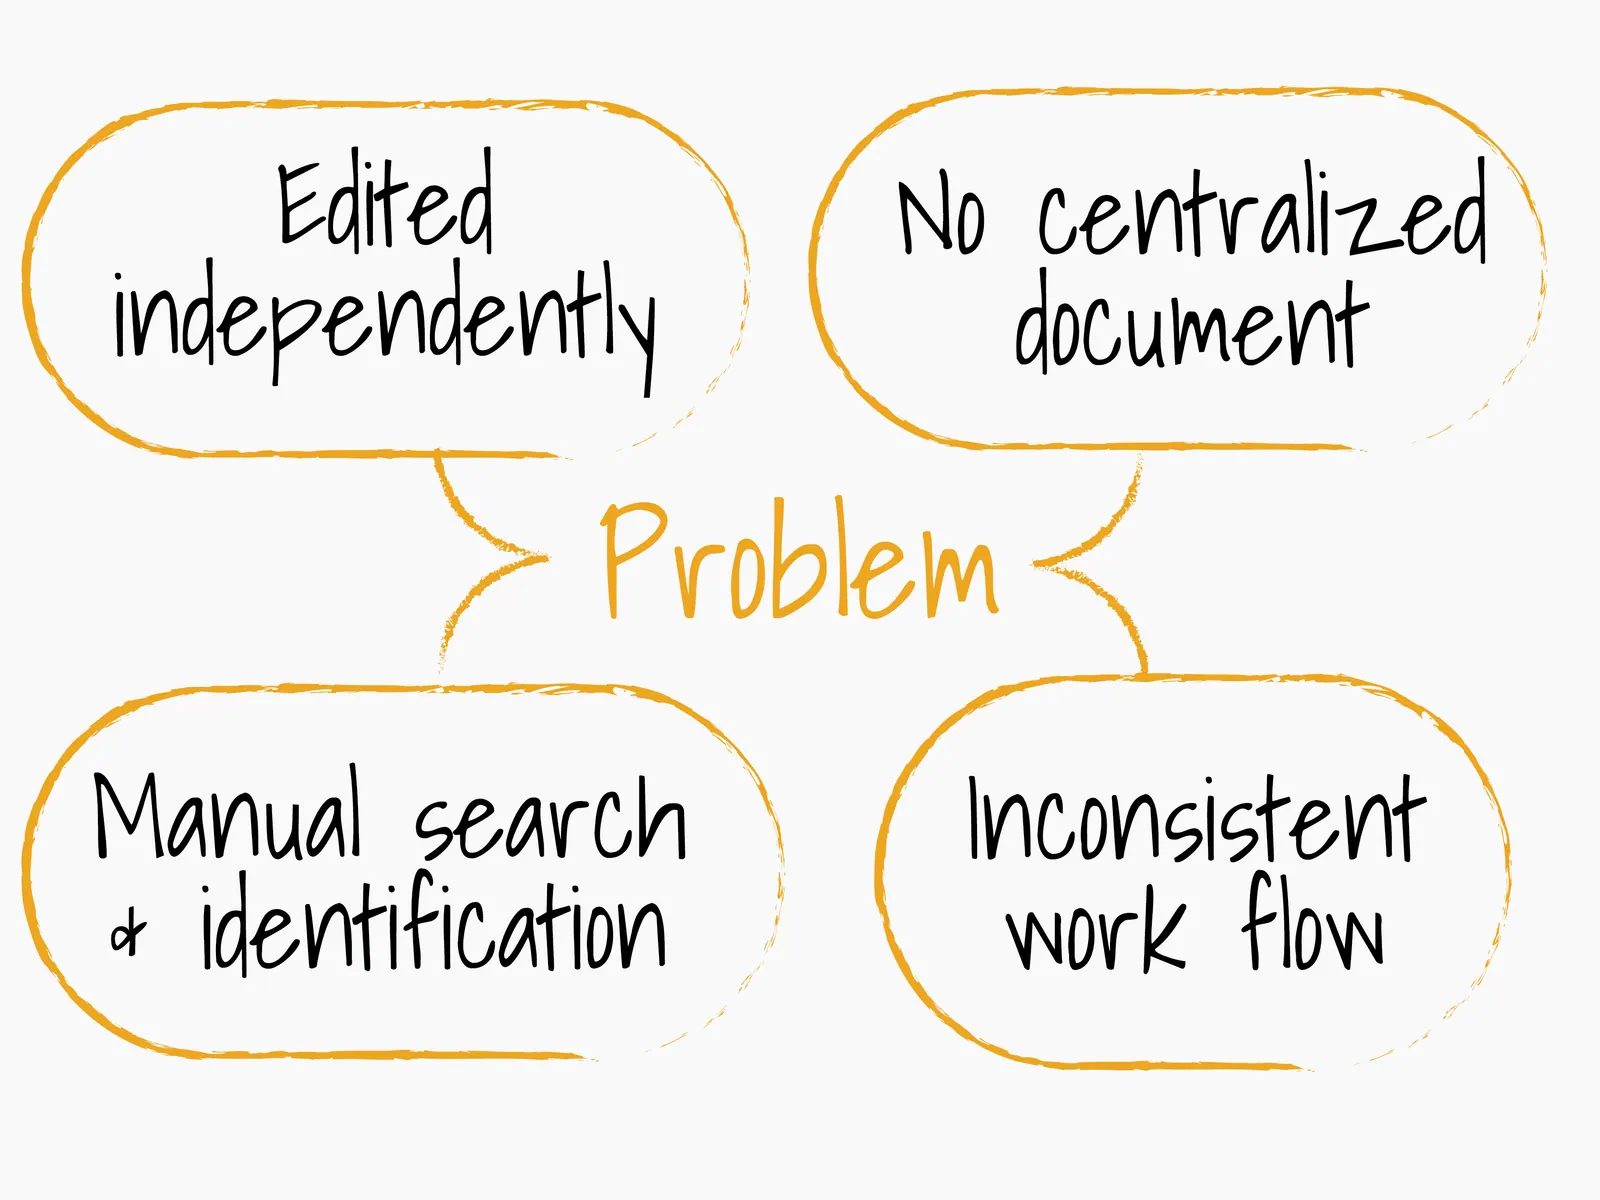
Manual update from Leasing team, through email and Whatsapp blast per daily or weekly or necessary basis.
Manual tenant’s information update for all types of signages.
Late signages production due to late signages artwork, hence complaint from the tenant, leasing, managers, customer and other related departments.
No checklist for signages tracking update, hence require manual surveillance on the ground, and continue the manual loop as item “1 to 3”.
The loop of update are so ineffective, single signage update require around 4 hours to complete the artwork including waiting time for approval.
The cognitive overload of doing the same thing all over again and again for the same task.
Strategy
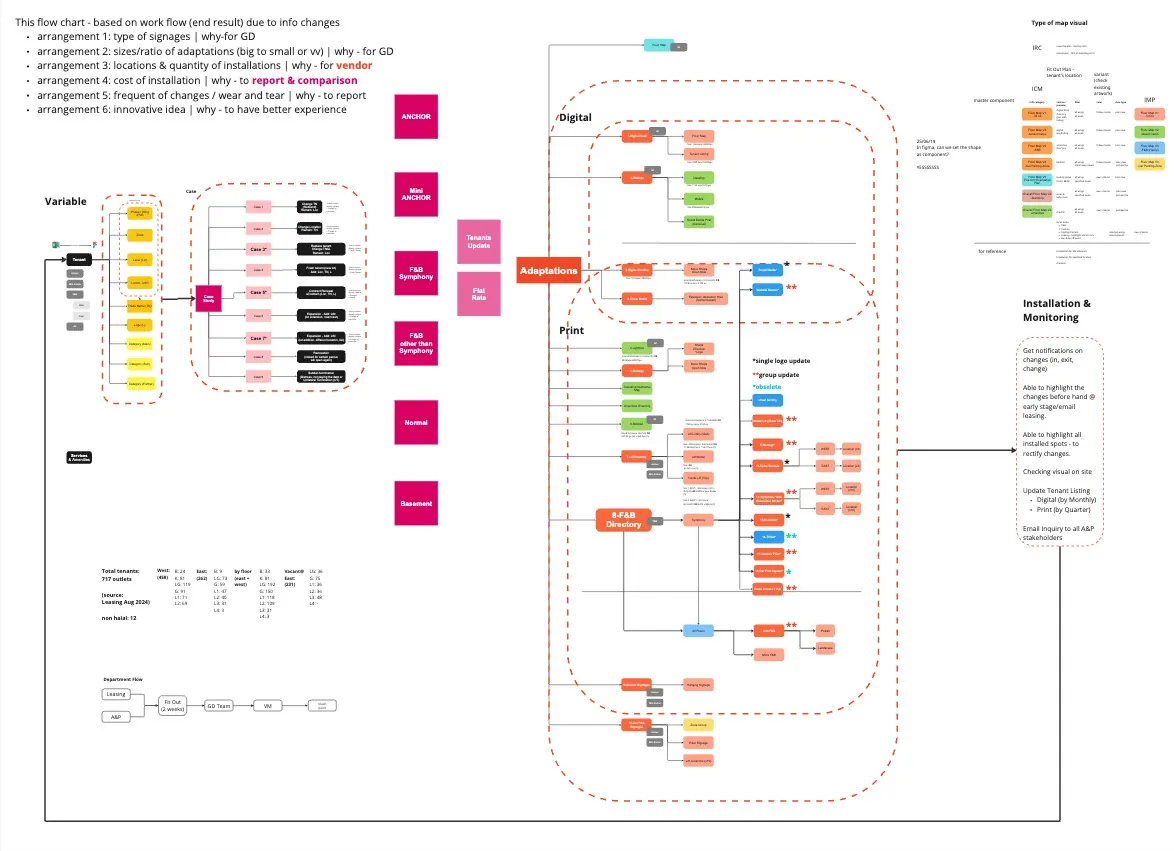
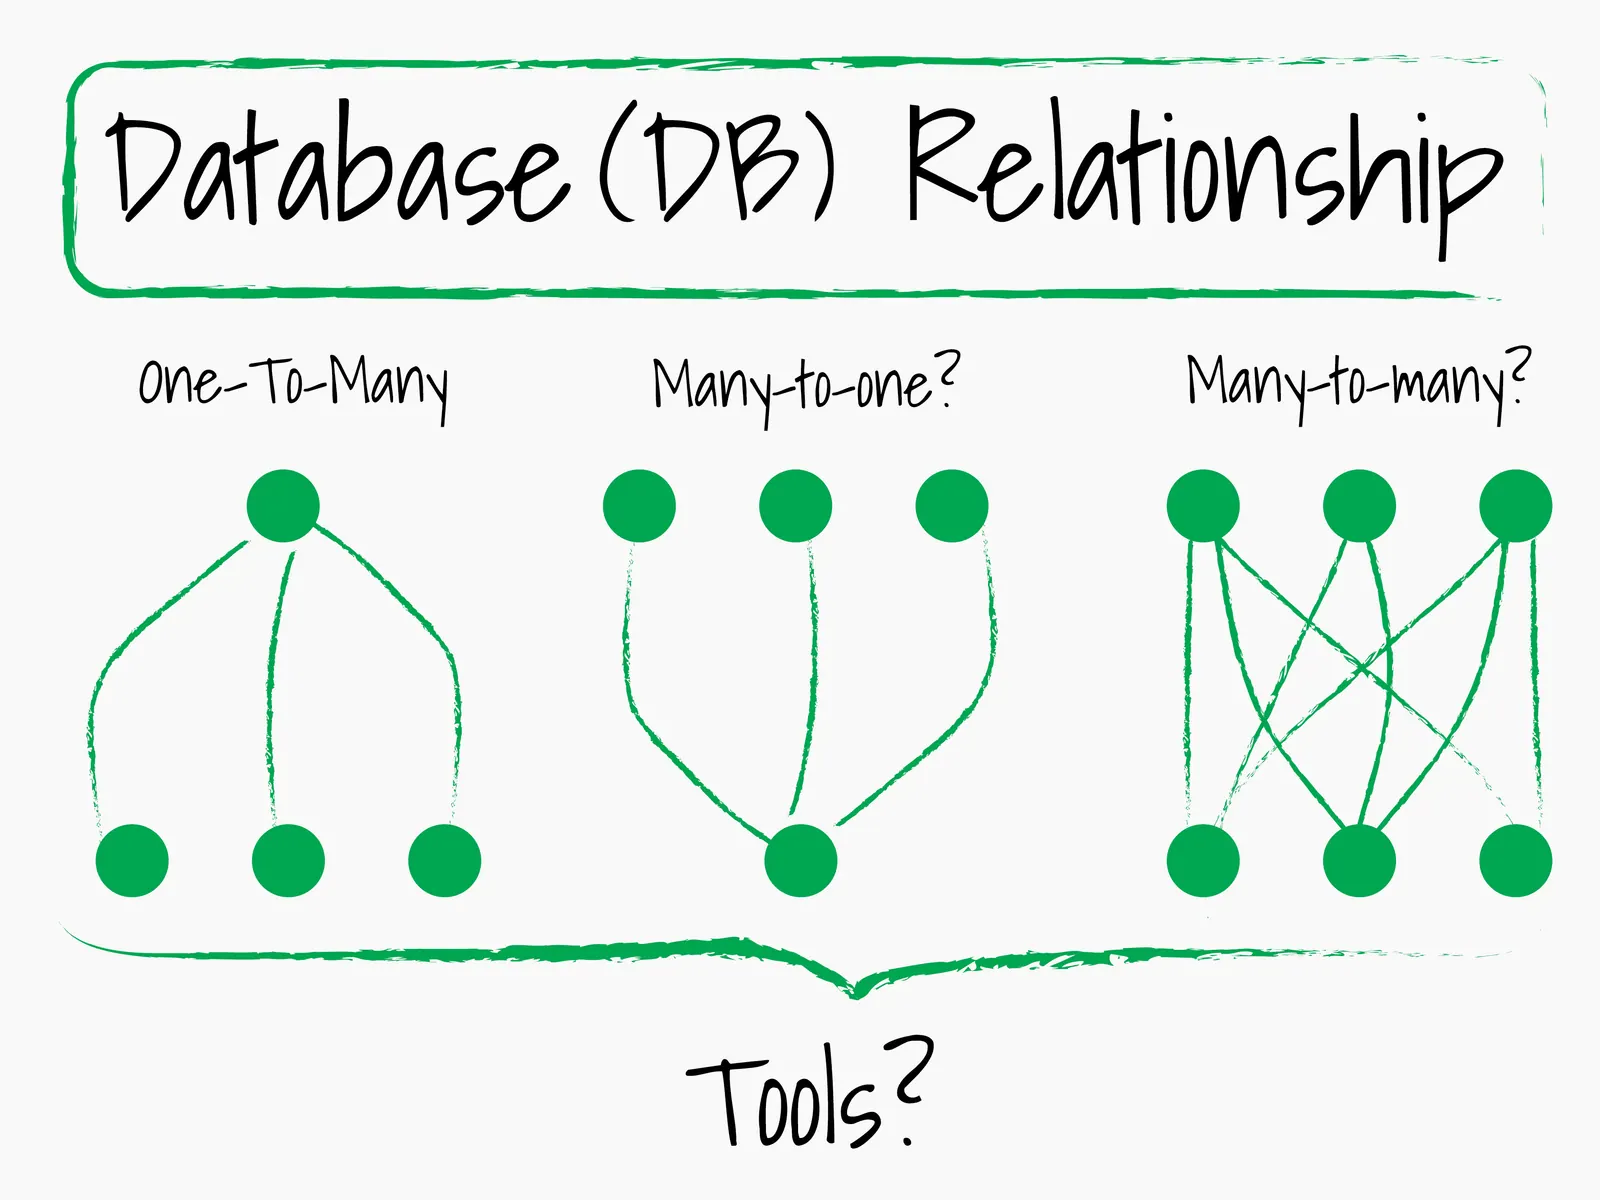
Identify any data relationship (one-to-many, one-to-one etc.) to the type of signages, grouping them into any possible category and make a flow chart.
Find the primary contact person or leasing admin for the tenant update and request the master file for that particular data.
Identify any possible tools for centralized and synchronized data update for the established relationship, reducing the manual loop as much as possible.
Execution
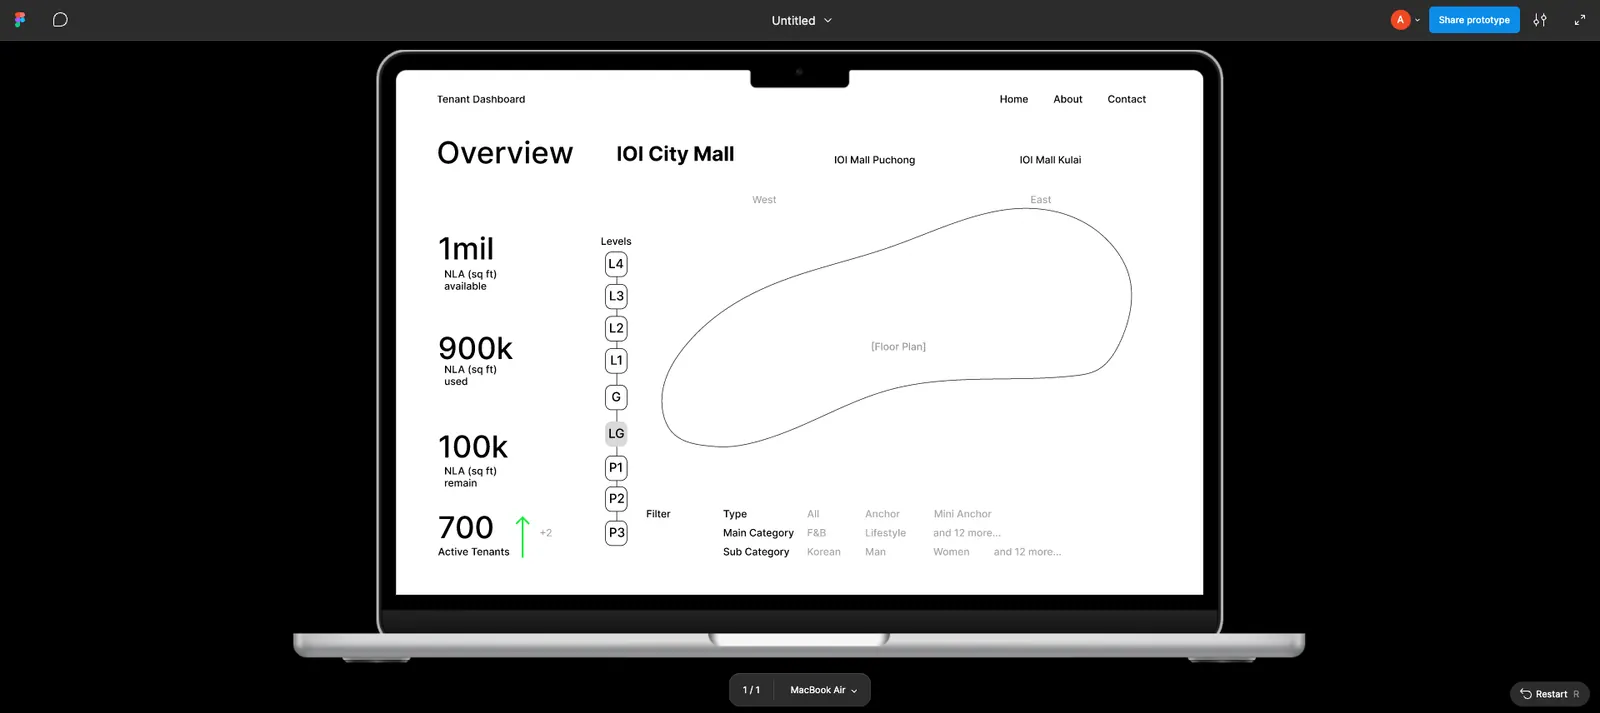
Drafted a single low-fi prototype for the dashboard to get consensus from other departments. These are their verbal feedback:
Leasing 👩🏻 - “It is good, but we can’t provide it at the moment due to our current priority is different”.
Fit Out 🧑🏻🦲- “We can only provide tenant listing 2 weeks before and after terms; fresh tenant, vacant position, and renovation in progress”
Visual Merchandising 👨🏻- “To avoid excess cost of printing, the tenant’s name should be finalised and approved by the respective department in charge.”
A&P 👧🏻- “We only have for space rental for event roadshow and 40 types of advertising space, and everything in a list. The only visual we have is from tenant’s side - visual for their own ads”. “If we have a lot of money then we can do centralise and automation workflow”
IT 💇🏻♂️- “You might have this soon, as early as next year because our company are currently consider this ERP type software”, which is far away still.
Created a simplified design system based on my current scope of work and the impact:
Reduce the time taken from 1 whole day just to update single visual adaptations of tenant listing (old version here) to 2 hours for updating 3 adaptations, which is faster.
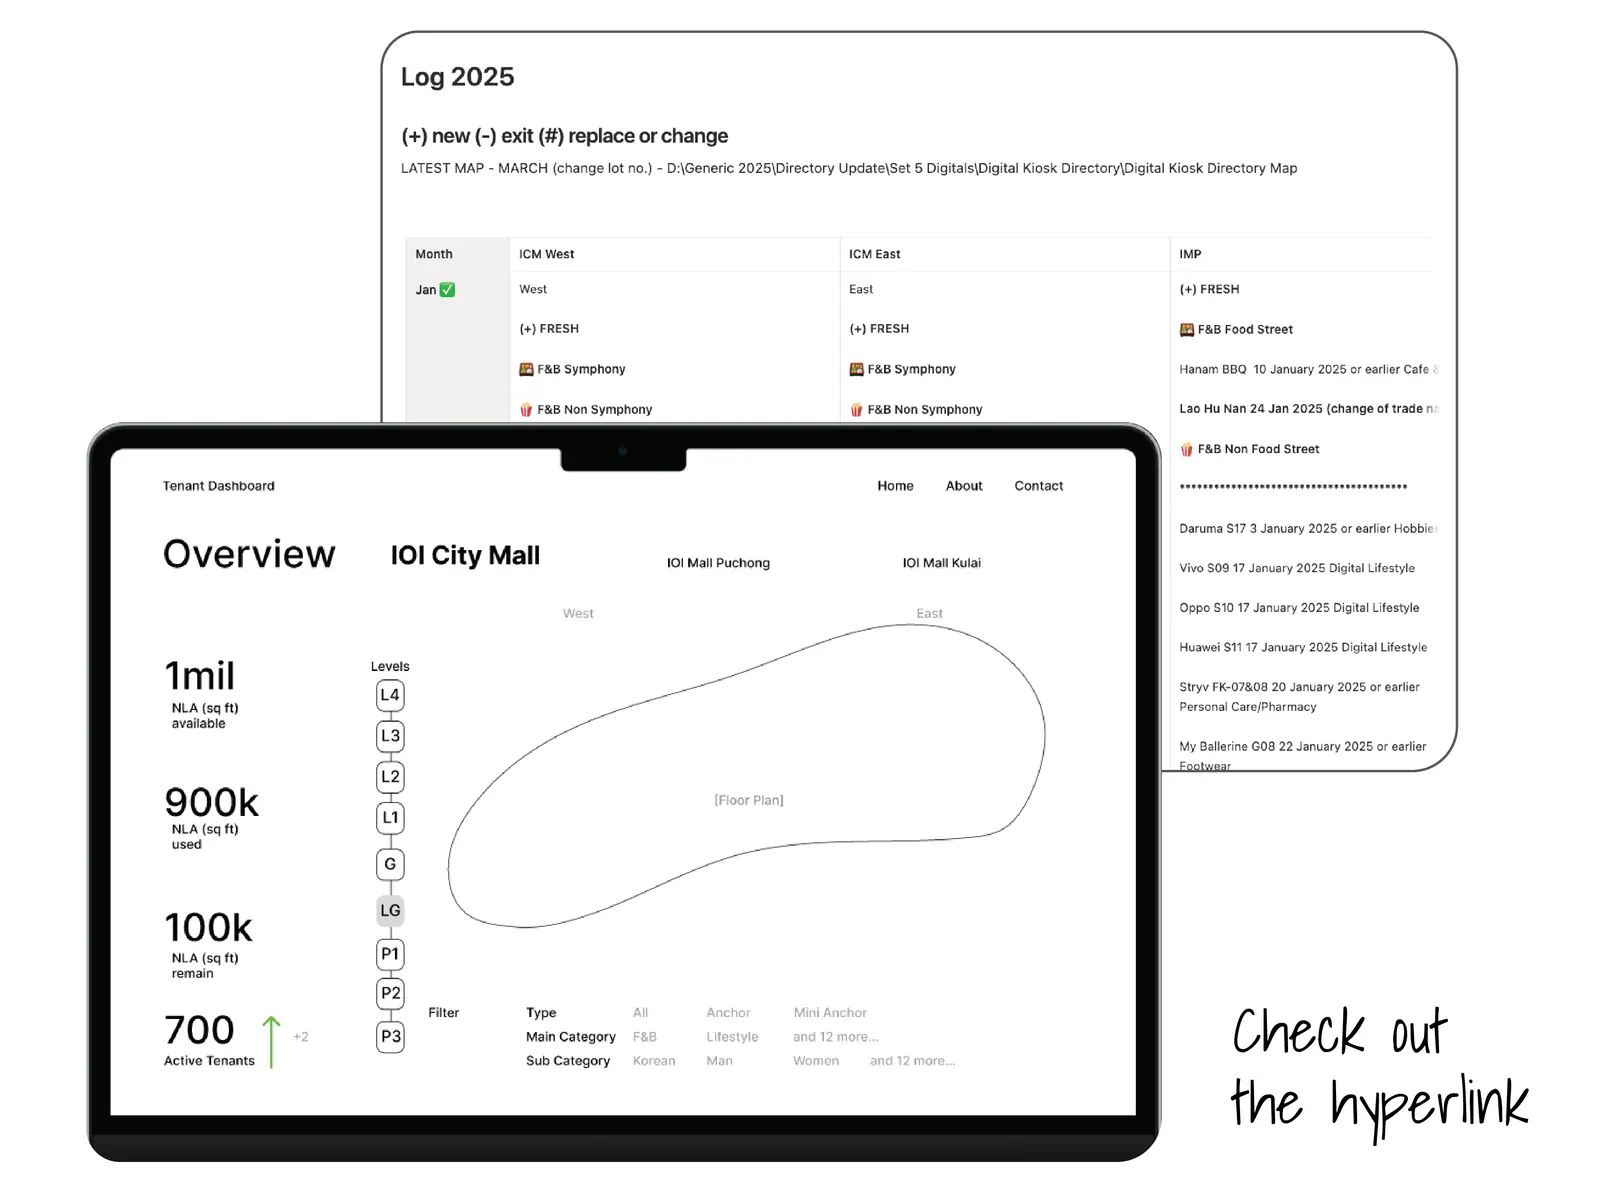
Created a monthly single dashboard table based on leasing’s weekly and daily email listing as a tool to track the progress update compared to repetitive search keyword in the email inbox.
However, all of the above solution are not sustainable for a longer term and still require manual work to check and verify since they are easily expose to human error. It happened once in 3 years and it made the CEO & tenant raised this issue in the meeting.
I also come to another realization, the core of the problem is not the visual artwork of the signages, but the news and status about the tenant are still treated manually, hence effecting the process chain afterwards.
ADOPTING A NEW STRATEGY
FROM GRAPHIC DESIGN to PRODUCT DESIGN
After communicating the problem and sharing the same realization, there is no further actions are being taken. As far as what I have known, the leasing department was subscribing for million-dollar deal Enterprise Retail Planning (ERP) software called as Yardi Voyager. However, there is still no interface or shared module similar or close to the prototype.
Taking another self-initiative, I scout again for any MVP tool that can complement the spatial reference problem, by combining large-scale tenant’s database information system and the allocated 2D vector floor map using 2D spatial data visualization for easy and fast reference, and less manual data entry and monitoring.
However, the solutions I need are lives in the gap between CAD (2D or 3D), Geographic Information System (GIS), Product UI and Operation (OPS) dashboard, creating a lot of unexpected frictions to make a functional MVP instead of prototype. In a nutshell, the closest solution is by using Autodesk REVIT combine with Power BI. Considering the complexity and budget constraint since this is only a personal initiative, I narrowed down the scale of working prototype.
Outcome
Instead of relying on the end-to-end manual works, I was able to presetting and shorten the middle processes by:
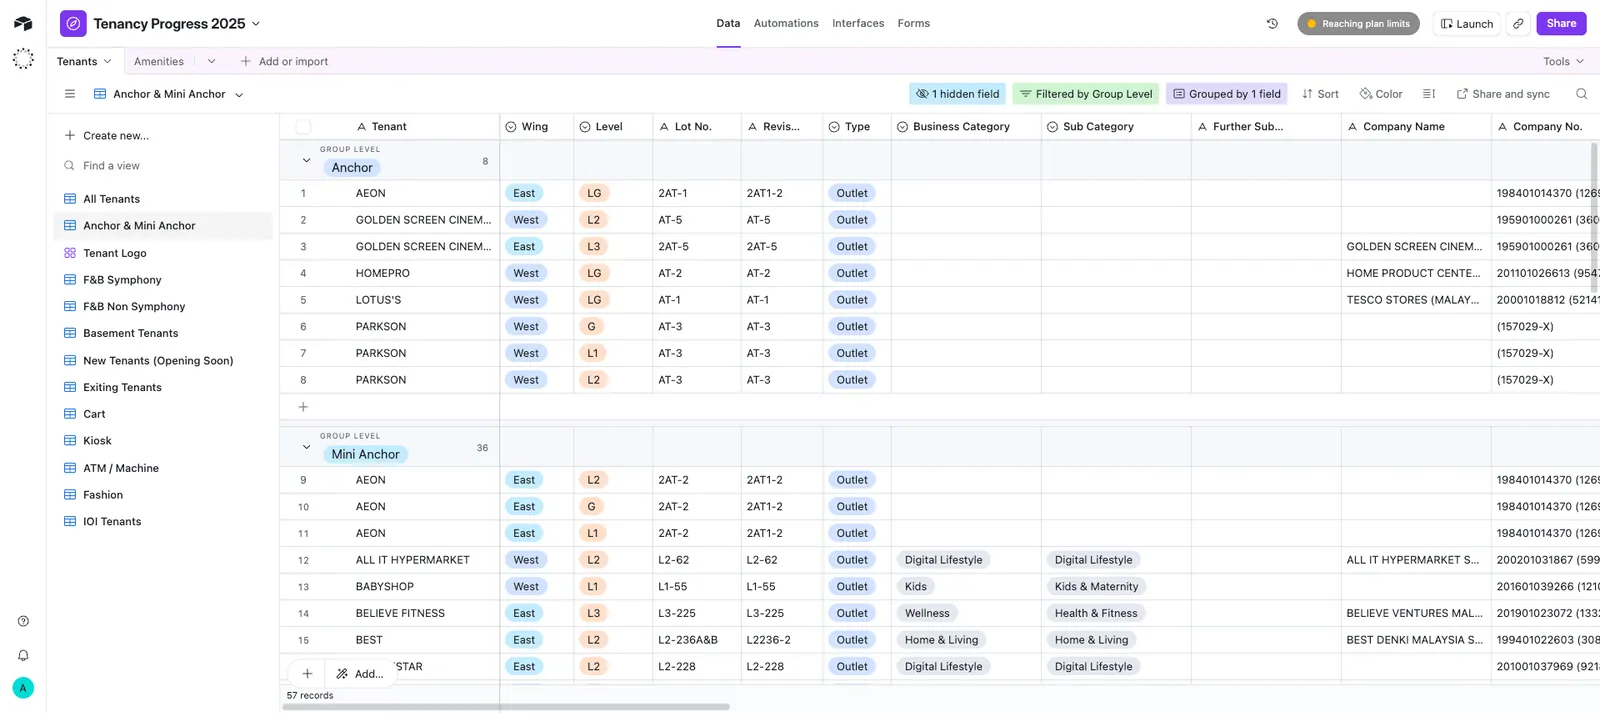
Using an Airtable free account as tenants database to store, view and function as dashboard. Free account allowed me to store 1,000 record, enough to replace Excel working sheet.
Converting the tenant’s name and its information as a component, in Figma. This allowed me to make a universal search for checking, editing, centralized editing and compose the layout and informations for all signages adaptation.
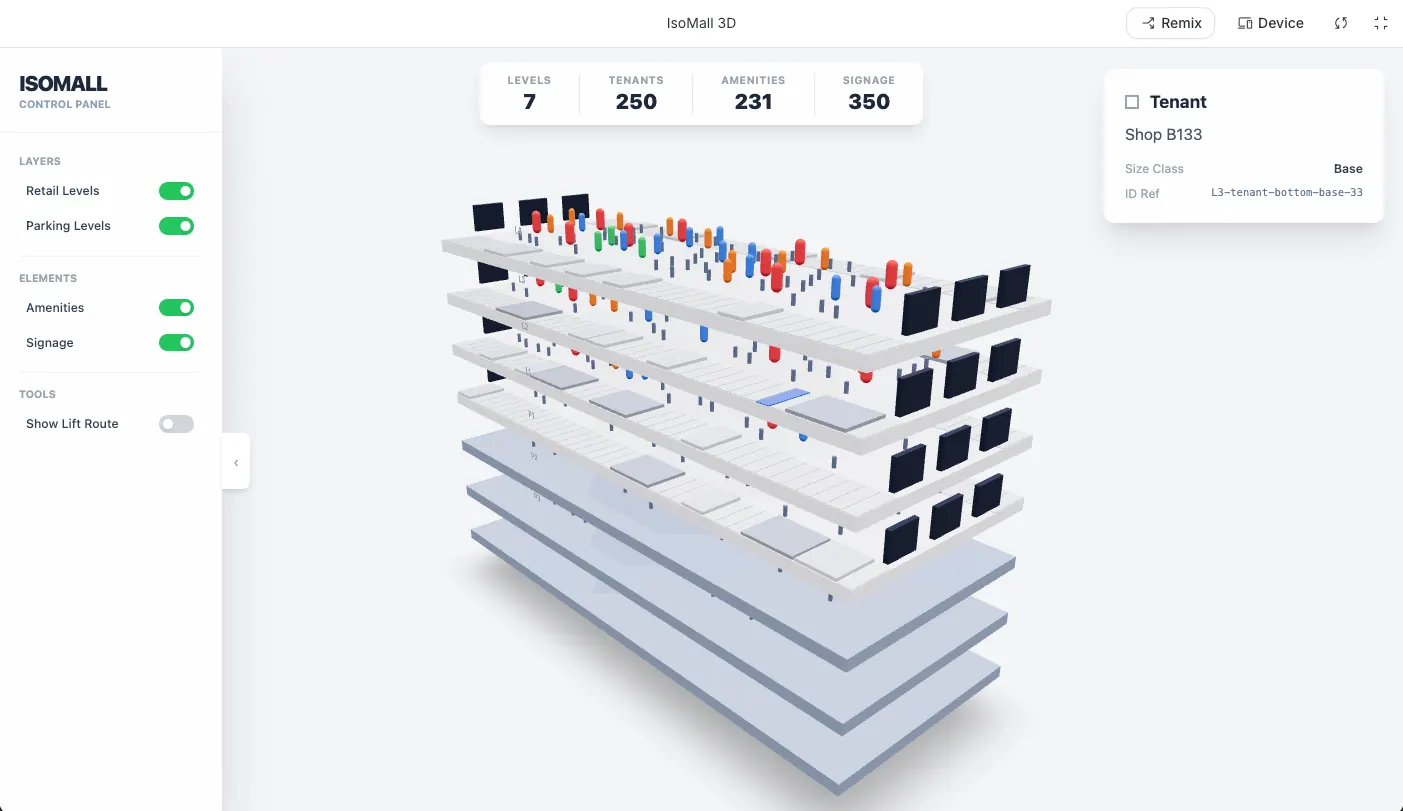
However, there’s no spatial data visualization to combine the above approaches.
Impact
These approach shorten the signages adaptations to a half day for all signages per set, saving around 3-5 days to update. It is a significant amount to reduce the manual check per line basis:
Old Method: 80 hours | New Method: 4 hours
Time Saved: 76 hours
Efficiency Metrics - Time Efficiency Ratio: 80 / 4 = 20x faster
Process context: Changes on tenant’s trigged > update visual > checking by manager > approval > creating FA prep (crop mark, die cut, material state, quantity to print) > send an email to print vendor.
With thanks to Ho Su Teng.